I. Sample
- Process
- We accumulated FYE financial information on Total Assets, Total Revenue, Net Assets, and Net Income from 176 past and current clients for the period 2007-2017, primarily using audited financial reports and 990 tax forms. We also collected the percentage of women on boards (WBD%) and percentage of women in senior leadership positions (WLP%) of those clients over the 11-year time frame primarily through internal due diligence documents and clients’ websites.
- We removed clients with fewer than 4 years of financial data available.
- We removed individual instances where net assets and net income were both negative in return on equity (ROE) calculations, which would result in a false positive ROE. We also removed one company from the sample, because it was an extreme outlier skewing the data.
- Result
- We obtained Revenues, Assets, Net Assets, WLP% for 161 companies, and WBD% for 156, over the 11-year period with an average of approximately nine years of financial data per company.
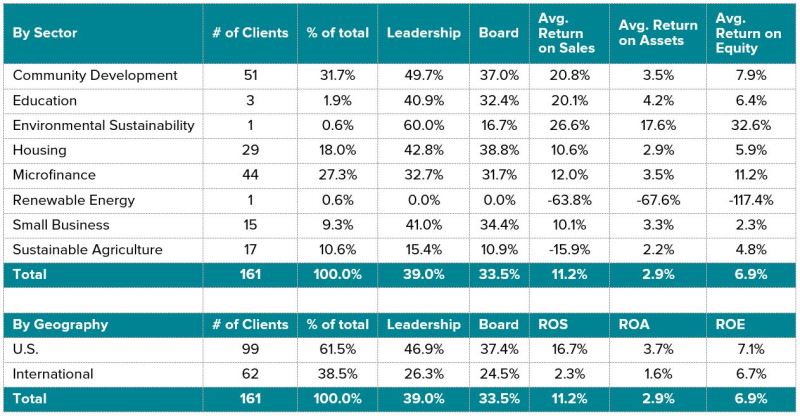
- The sample consists of companies from eight different sectors, with just under 80% of the sample coming from the Community Development, Microfinance, and Housing sectors. 61.5% of our sample is US-based, while 38.5% are International (domiciled-abroad).
II. Grouping
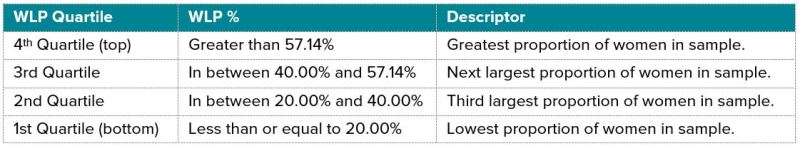
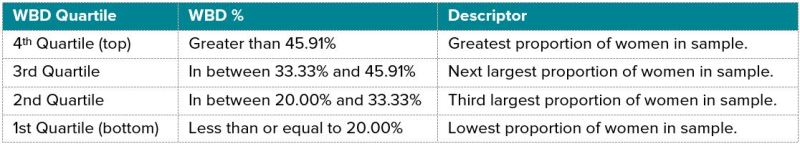
Using previous studies that looked at gender vs financial returns for S&P 500 companies as a template , we grouped the sample into four roughly equal sized quartiles for WLP%, and four separate roughly equal sized quartiles WBD% as follows:
III. Average results for the entire period
- When taking the average financial performance of each quartiles over the 11-year period, the three quartiles representing the highest proportions of women in senior leadership and boards (4th quartile, 3rd quartile, 2nd quartile) performed substantially better than the group with the lowest WLP% proportion (1st quartile). The largest difference overall was between 1st quartile and 4th quartile.
- The results are mixed when evaluating WBD%. The three quartiles representing the highest proportions of women on board positions outperformed the quartile with the lowest WBD% when measuring ROS or ROA, but the same general effect is not true when measuring ROE, despite the best ROE coming from the 4th quartile grouping.
IV. Year over Year comparison
- If the number of women in senior leadership or holding board positions has a positive effect on financial performance, we would expect to consistently see the top quartile outperform the bottom quartile on a year by year basis. When taking the averages of the financial performance of the quartiles on a yearly basis, we see that the top quartile of our sample generally outperforms the bottom quartile for the WLP grouping, but not the WBD grouping.
- For WBD, the top three quartiles
- When comparing the bottom quartile with each of the other 3 quartiles, the bottom quartile will outperform on ROA and ROS 3-4 years out of the 11-year period.
- When viewing the top 3 quartiles as a whole against the bottom quartile, the bottom quartile only outperforms the top 3 in 2008 and 2009 in ROA by an average difference of about 1.5%.
- In terms of ROS, the bottom quartile outperforms the top 3 in 3 years (2 of which are also 2008 and 2009) with an average difference of around 3.7%
- We also see the relationship does not appear to hold nearly as strongly on a yearly basis for ROE. We theorize that ROE as a measure of financial success among our sample could be less reliable than ROA and ROS because we found multiple instances where a company reported negative equity with positive returns and other instances where a company’s equity dramatically shifted from one year to the next because of a large injection of equity (philanthropic or commercial) unrelated to retained earnings.
V. US v International
We were also curious to see if these trends remained the same when we broke down the sample down to Domestic and International companies.
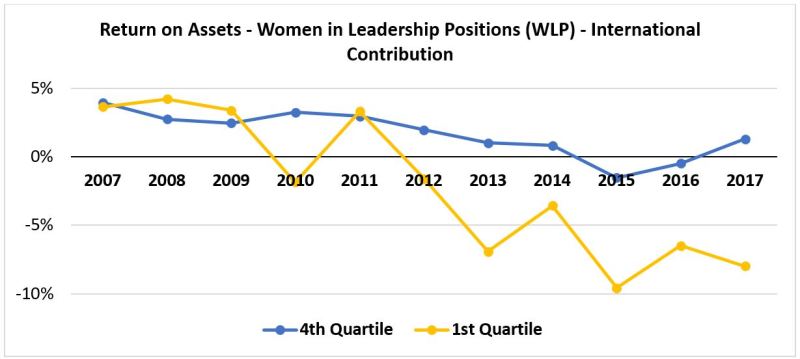
- For WLP, the trend for U.S. companies in the sample remained mostly the same on a yearly basis, though the difference between top and bottom quartiles was smaller. The trend for International companies also remained mostly the same on a yearly basis, although the difference between top and bottom quartiles were larger and the performance of the quartiles was more volatile. One possible explanation for this is that the difference in average WLP% between the top and bottom quartiles for the U.S. and International clients are very different. The difference for the U.S. quartiles is 60 percentage points whereas the difference for the International averages is almost 75 percent. The same holds true for WBD%.
- Additionally, average participation for the bottom International quartile is much lower than for the U.S. groups, with 1 woman for every 27 managers vs 1 woman for every 12 managers respectively.
- Another possible explanation is that the International companies are subject to wider and more diverse macro effects because the grouping is comprised of companies from many different countries, some of which have a much less stable business environment than the US. Again, ROE does not show any consistent relationship.
- Still, and regardless of this last point, returns for the bottom International quartile show high degrees of volatility, whereas returns for the top international quartile exhibit returns in line with the ones observed in the top US-based quartiles.
VI. Ratio Tipping Points
While the range of 10-year Average ROA vs WLP% is somewhat scattered, the concentrated group of values exhibits a slight bell curve with a relative maximum around 50%. As you move from lowest to highest WLP%, the group seems to begin to increase more steadily around 30% WLP and decrease more steadily around 70% WLP.
VII. Volatility
While the returns of the international companies in the bottom quartile and top quartile WLP% intersect across multiple years, the top quartile not only outperformed the bottom quartile on average over the 11 year period but was also significantly less volatile than the bottom quartile. The range of year-over-year average ROA for the international companies within the top quartile was 5.5%, while the range for the bottom quartile was 13.8%.
VIII. Summary
On average, companies in the higher quartiles of WLP% and WBD% outperform the bottom quartile. This remains true on a year-by-year basis for WLP%, but not as consistently for WBD%. The trend also remains true when the sample is split by U.S. and International companies, though the magnitude and volatility of the differences vary by region. This suggests that the %WLP may be a key driver of financial performance.